OnPrintShop v12.3 is here: Smarter Personalization, Smoother Workflows & Admin Controls - Learn More
Back to Blog Page
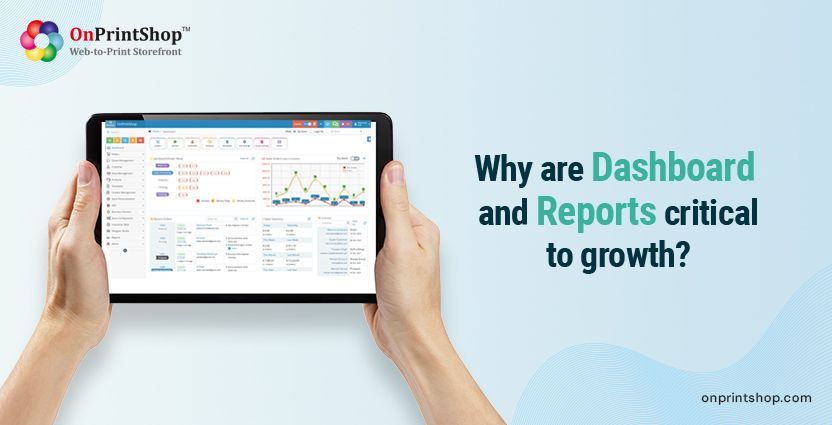
Why are Dashboard and Reports Critical to Growth?

Have you been in a situation where you were shocked to find that one of your key clients has stopped working with you over six months?
Do you know how many quotes did not convert into order?
Do you struggle to find out why orders are delayed?
Can you figure out Bad Debts allowing excess pay on account?
Wrong decision-making not having accurate data?
These are the common challenges with many print companies, as they are tied up in managing multiple processes and don’t have centralized data and easy reports to analyze. So most of the time, they are in reactive mode and make decisions based on feelings rather than facts.
This blog will help you understand how we have helped small to large print companies organize data and reports to make proactive decisions and control their business.

Why Reports and Dashboard are key?
Here are the reasons why the reports and dashboard are the keys:
- Illuminate insightful information that otherwise would be hard to find.
- Efficiently track multiple data sources.
- 65% of Customers will not return if they do not get a good first experience.

This does not only mean that you fix customer service but also offer the right products and services, simplify estimation and order, and deliver orders on time. You could be small or big and extremely successful today, but you still need to analyze your sales and production reports on a daily basis.
The business environment is dynamic, and the Customers’ preferences change with time. That’s why you need to analyze data, as it helps to identify patterns, identify changes, and give ideas to make proactive decisions to stay ahead in your game.
Interactive Reports and Dashboard help you to
- Increase productivity
- Save money
- Allow visibility into the business
- Reduce time spent building reports
- Hold your team accountable

How to capture data?
The first step is to set up an order management solution that helps you centrally manage all your customers and orders instead of manually processing orders or managing excel sheets.
Every quote and order process should be captured to gather data and generate real-time reports.
This helps you to track every order on the Job Board. Using colors, you can identify if the job is being processed in time or if it is stuck in which department. This helps to intervene, identify reasons and find long-term solutions to deliver 100% orders on time.
Data Analysis
Research indicates that companies that use Reports and Dashboards are
- 3x as likely to execute decisions as intended
- 5x as likely to make decisions much faster than market peers

The dashboard gives you a comparison to track sales changes – weekly, monthly, and annually.
For Multiple channels, centralized reporting is available to view reports of multiple stores combined or individually too
You can also integrate Google Analytics to analyze website visitors and other information and further integrate third-party tools to capture feedback and analyze data.
Multiple Reports to analyze sales, customer, and product-specific reports.
Further, you can export reports in XML and CSV to third-party business tools that can help make proactive strategic decisions.
Book a demo that help you set up print order management to make decisions based on facts and not on feelings.
#1 Web to Print Software.
By submitting this form, you agree to our Privacy Policy


