

Every few months, someone publishes a new web to print market report. The numbers shift, the CAGR changes slightly, the projected market size goes up or down depending on what the analyst decided to count. Most people either cite the figure that suits them or give up and ignore the data entirely.
This web to print software stats article tries to do something more useful. It takes the statistics that actually matter for print businesses in 2026, puts them next to each other, and says what they mean.
Not in a "here are 60 facts" way. In a "here's what this tells you about your business" way.
A quick note on sourcing: the web to print software statistics below come from independent market research firms and industry analysts. Where reports disagree and they do, often; both numbers are included with an explanation of why they differ. A range is not a sign of bad data. It usually means two firms measured slightly different things.
About This Data● Sources include Grand View Research, Market Research Future, Mordor Intelligence, IMARC Group, Precedence Research, SkyQuest, Polaris Market Research, Straits Research, and others.● Web to print software figures (typically $1–7B range) measure standalone W2P software platforms. Broader W2P market figures (typically $26–57B range) include print services, hardware, and fulfillment. That is a different scope.● This distinction matters. Both datasets are used here, clearly labeled.● OnPrintShop has served 2,000+ print businesses across 18+ years in the web to print industry. No proprietary platform data is used in this article unless labeled.
Web to Print Software Statistics: Editor's Choice
If you only read one section, read this one. These are the numbers that tell the story in the fewest words.
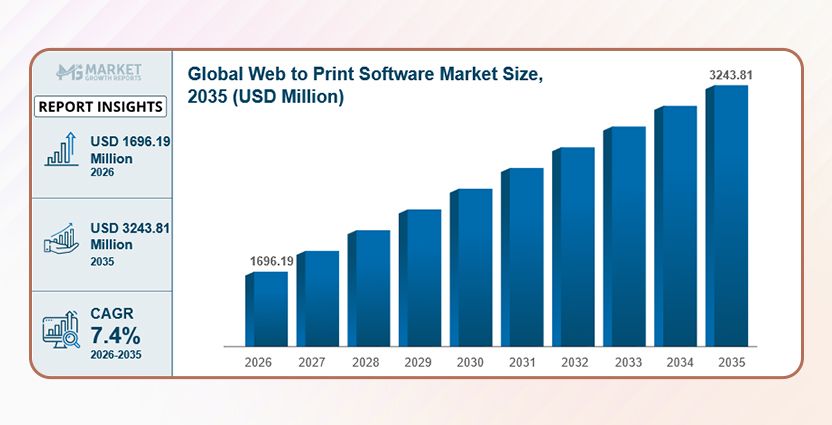
1. The web to print software market was valued at approximately $1.47 billion in 2024 and is projected to reach $2.81 billion by 2033, at a CAGR of 7.4%.
This refers specifically to W2P software platforms, the tools print businesses use to run storefronts, manage orders, and automate production. It's a mid-market number, but the trajectory is clear and consistent across multiple reports. (Source: Market Growth Reports, 2024)
2. The broader web to print market (which includes services, hardware, and fulfillment) stood at $34.31 billion in 2024 and is forecast to reach $57.50 billion by 2034 at a CAGR of 5.3%.
This larger figure reflects the full economic footprint of online print ordering, from software to press to delivery. For businesses selling or buying print, this is the market they're actually operating inside. (Source: Expert Market Research, 2024)
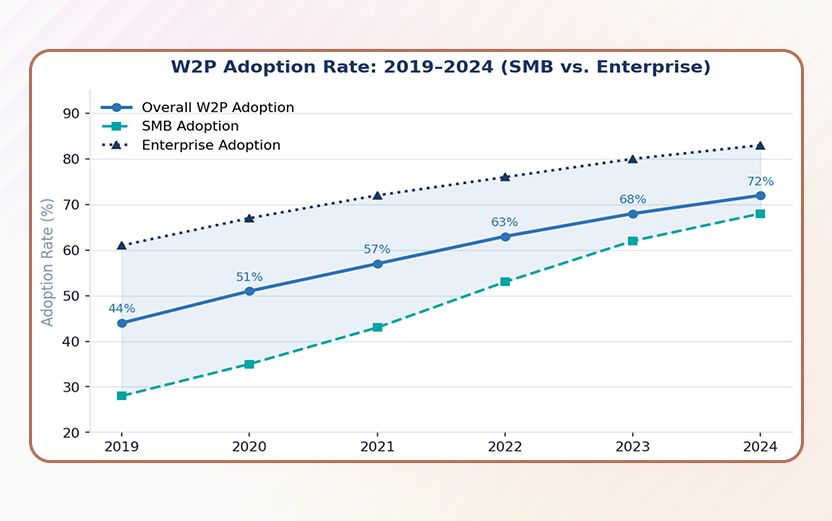
3. Over 72% of printing companies had adopted web to print solutions by the end of 2024.
Nearly three out of four printers are already on the platform. The question for the holdouts is no longer whether to adopt. The question is how long they can afford not to. (Source: Market Growth Reports, 2024)
4. The Asia-Pacific region is projected to grow at a CAGR of 12.5% through 2032, the fastest of any region.
North America currently holds the largest share of the W2P software market (40%+), but the growth story is in Asia-Pacific, driven by India, China, and Southeast Asia's expanding digital print infrastructure. (Source: Market Research Future, 2025)
5. The print on demand market is valued at approximately $12.96 billion in 2025 and is growing at a CAGR of 25.3%.
POD is the fastest-moving segment in print. At this rate, it's not a niche. It's an industry vertical in its own right, and web to print software is the platform layer that makes it run. (Source: Straits Research / Grand View Research, 2025)
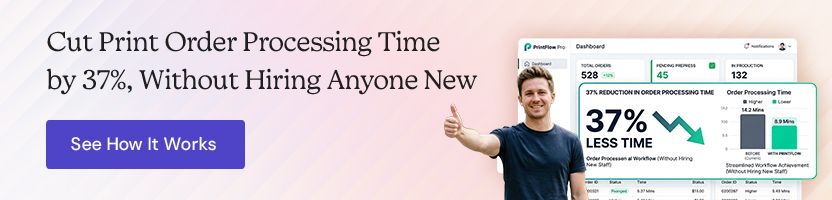
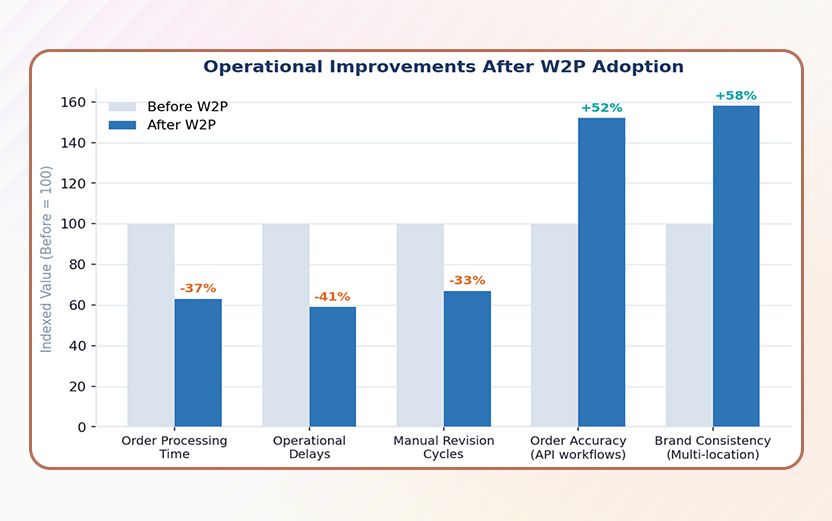
6. Average print order processing time has decreased by 37% with the adoption of W2P solutions.
Operational efficiency is the most direct business case for W2P. More than a third of processing time simply disappears when orders move from phone and email to self-service digital storefronts. (Source: Market Growth Reports, 2024)
7. 80% of print professionals say AI and automation are essential to improving workflow, reducing cost, and supporting future innovation.
This near-consensus should settle the debate about whether automation matters to print. What it doesn't settle is the implementation gap: only 55% of those same respondents are currently investing in the technologies they said are essential. (Source: Infigo / Industry Survey, 2025)
What This Means for Your Print Business● Stat 7 is the one worth sitting with. 80% of your competitors agree automation is essential. Only 55% are moving on it. If you're in that 55%, you're building distance. If you're in the other 45%, the window for catching up without pain is closing.● The 37% processing time reduction (stat 6) is the clearest ROI signal in this dataset. It's not a projection or a case study from one outlier shop. It's an average.
The headline numbers make the case. But, the market sizing data below fills in the details, including why the figures vary so dramatically depending on which analyst you read.
Web to Print Market Size & Growth Statistics
The range of market valuations you'll find for this sector is wide enough to be genuinely confusing. $1.5 billion. $6 billion. $34 billion. All from credible firms, all for roughly the same year. The explanation is scope, not incompetence.
8. The W2P software market was valued at $1.19 billion in 2023 and is projected to grow to $4.95 billion by 2032 at a CAGR of 16.5%.
One of the more aggressive growth projections in the dataset. At 16.5%, this implies the software layer is gaining share faster than the broader market, a pattern consistent with SaaS penetration in other industries. (Source: SkyQuest, December 2025)
9. Market Research Future places the W2P software market at $6.32 billion in 2024, growing to $18.69 billion by 2035 at a CAGR of 10.36%.
Different scope assumptions explain the range between reports. MRFR's estimate includes cloud platform revenues that narrower reports exclude. When two credible firms disagree this sharply, the honest answer is: the market is large and growing. (Source: Market Research Future, 2025)
10. North America accounted for over 40% of the global W2P software market in 2024.
U.S. commercial print infrastructure, combined with high e-commerce penetration, makes North America the dominant market. That lead is real but narrowing as APAC scales. (Source: Market Growth Reports / StartUs Insights, 2024)
11. Europe captured approximately 29.1% of the global W2P software market in 2023.
Europe's mature printing industry and strong SMB base make it the second-largest regional market. The EU Deforestation Regulation (enforceable from December 2025 for large firms) is adding compliance pressure that is pushing brands toward traceable, on-demand production. (Source: Market Research Future, 2023; Mordor Intelligence, 2025)
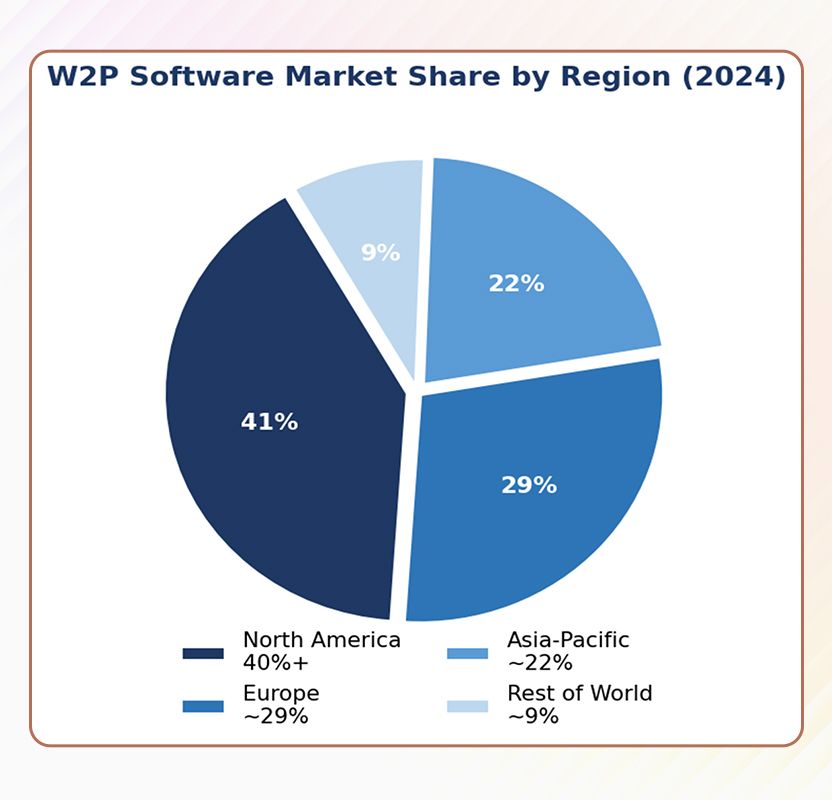
Pie chart showing North America (40%+), Europe (~29%), Asia-Pacific (~22%), and Rest of World (~9%). The callout in the caption should note APAC's 12.5% CAGR versus North America's ~7%.
Regional W2P Software Market Snapshot
12. The broader web to print market is expected to reach $26.59 billion in 2025 and grow to $35.07 billion by 2030 at a CAGR of 5.69%.
This is the Mordor Intelligence figure, widely cited, and useful because it tracks the full transaction value of online print ordering, not just the software layer. (Source: Mordor Intelligence, 2025)
13. IMARC Group values the broader W2P market at $34.78 billion in 2024, projecting $51.89 billion by 2033 at a CAGR of 4.32%.
IMARC and Mordor give different base year figures, but both point to the same direction: steady, multi-year growth with no sign of a plateau. (Source: IMARC Group, 2024)
14. There are currently approximately 228,000 active print-on-demand stores worldwide, representing nearly 5% of all online shops.
One in twenty e-commerce stores is now running a print-on-demand model. That is not a fringe phenomenon. It is a structural shift in how physical goods get made and sold online. (Source: Expert Market Research / Mordor Intelligence, 2024)
Web to Print Software Market Sizing Reference Guide
What This Means for Your Print Business● The honest answer to 'how big is web to print software market?' is: large, growing, and measured differently by different people. Understand what a figure includes before you use it in a presentation or a funding deck.● 228,000 active POD storefronts is a pool of potential B2C customers for W2P platforms that didn't exist in any meaningful size five years ago.
Market size tells you the opportunity. Print on demand data tells you where the fastest money is moving right now.
Print on Demand (POD) Market Statistics
Print on demand is the most visible consumer-facing layer of web to print. The growth rates here are exceptional, and the business model change they represent is permanent.
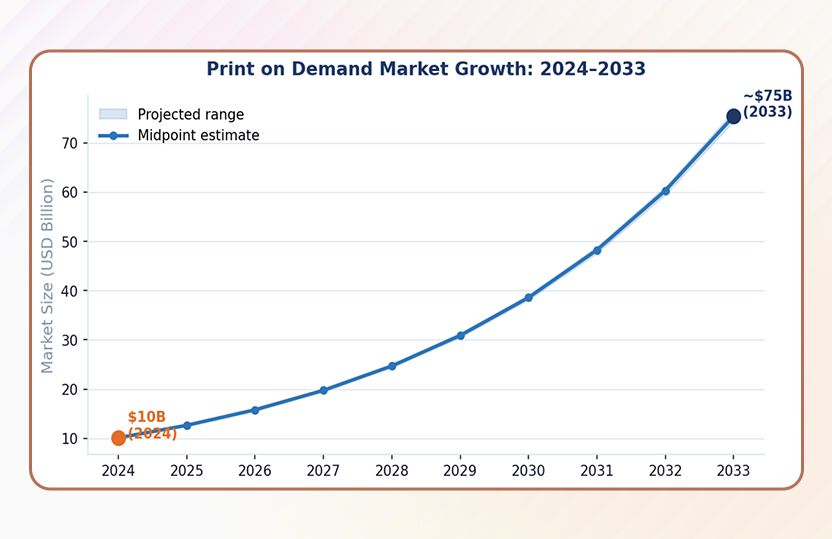
15. The global POD market was valued at $9.89–$10.21 billion in 2024, depending on the source, and is projected to reach $75–$103 billion by 2033 at CAGRs ranging from 25% to 26%.
The range is wide, but every credible source agrees on two things: the 2024 base is roughly $10 billion and the growth rate is roughly 25%. At that pace, the market triples in size every five years. (Source: Straits Research; Precedence Research; IMARC Group, 2024–2025)
16. North America held a 36–40% share of the global POD market in 2024, with the U.S. alone valued at $2.53 billion.
The U.S. POD market is expected to reach $26.95 billion by 2034, a tenfold increase from today. That's driven by creator economy growth, platform integrations with Shopify and Etsy, and an established fulfillment infrastructure. (Source: Precedence Research; Grand View Research, 2024)
17. Asia-Pacific is the fastest-growing POD region, projected to expand at a 28–30% CAGR through 2034.
China's clustered supply chains and India's rapidly digitizing textile manufacturing base are the two engines. Both are pulling more short-run, customized orders online. (Source: Precedence Research; Mordor Intelligence, 2024)
18. Apparel accounts for 39–41% of POD revenue, making it the largest product category.
Apparel is the gateway product for most POD sellers, but the fastest-growing category is home décor, which is expanding at a 27–28% CAGR. That shift matters for W2P platforms deciding where to invest in template and product libraries. (Source: Grand View Research; Mordor Intelligence, 2025)

19. Software platforms account for 70.24% of POD market revenue, well ahead of service-based fulfillment.
The software-heavy revenue split confirms what the market structure looks like: the value is in the platform layer, not the physical production layer. This is consistent with W2P economics more broadly. (Source: Mordor Intelligence, 2024)
20. Only about 24% of POD shops are still operating three years after launch.
A 76% failure rate in three years. That number gets cited a lot as a warning. It shouldn't be read that way. Small business failure rates generally run similarly high, and the POD shops that fail aren't the ones that invested in proper infrastructure. They're the ones that launched a print storefront account on a Saturday afternoon and expected passive income by Thursday.
The print businesses with real storefronts, real brand assets, and real W2P workflows built on top of them survive at a much higher rate. That distinction matters for how W2P platforms think about their actual customer base.
21. Average POD profit margins run around 20%, with some niches reaching 30–60%.
Margin varies dramatically by product, niche, and fulfillment cost. POD is not inherently thin-margin. It depends almost entirely on what you're selling and who you're paying to fulfill it. (Source: Podbase / Straits Research, 2025)
What This Means for Your Print Business● At 25%+ CAGR, POD is growing 3–4x faster than the broader commercial printing market. The question worth asking is not 'should we be in this?' but 'why aren't we capturing more of it?'● The 76% failure rate is not a market warning. It's a customer quality filter. The shops that survive are exactly the customers W2P platforms should be building for.
POD's growth is partly driven by the broader shift in commercial printing from analog to digital production. The next section covers that transition at the industry level.
Online & Commercial Printing Industry Statistics
Commercial printing is not declining. It's slow-growing and structurally shifting. Those are different things, and the difference matters for how you read the numbers below.
22. The global commercial printing market was valued at $501.36 billion in 2024 and is expected to reach $598.06 billion by 2030 at a CAGR of 3.2%.
A $500B+ market growing at 3% is still adding $15 billion a year in absolute value. The headline rate looks modest; the absolute numbers are not. (Source: Grand View Research, 2024)
23. The global digital printing market was valued at $30.22 billion in 2024 and is projected to reach $59.93 billion by 2034 at a CAGR of 7.09%.
Digital printing is growing at more than twice the pace of commercial printing overall. That gap is the migration story: offset volume is holding or declining; digital volume is expanding. (Source: Precedence Research, 2024)
24. Over 60% of the commercial printing industry has shifted to digital printing technologies as of 2025.
The structural transition from analog to digital is largely complete in commercial print. W2P software is the natural complement to digital production infrastructure. (Source: RevenueMemo / Industry Data, 2025)
25. The shift toward on-demand printing has increased by 50%, enabling cost-effective short-run production.
Short-run, on-demand printing only works economically because digital infrastructure (both hardware and software) made it so. W2P platforms are a direct beneficiary of this structural change. (Source: RevenueMemo, 2025)
26. The U.S. commercial printing market was valued at $127 billion in 2024 and is expected to reach $150.5 billion by 2030 at a CAGR of 3.1%.
The United States alone accounts for roughly 25% of global commercial printing revenue. The digital and online print segments within that figure are growing faster than the headline number. (Source: Grand View Research / Horizon Databook, 2024)
27. The global digital print market is worth $167.5 billion in 2025 and is forecast to grow to $251.1 billion by 2035.
This broader figure includes all digitally produced print: packaging, labels, commercial, textile, and more. It captures the full industrial scope of the digital print transition. (Source: StickerYou / Industry Aggregation, 2025)
28. Inkjet technology accounts for 55% of digital printing applications; laser printing holds 30%.
Inkjet dominance reflects the economics of high-volume, variable-content production. Most web to print jobs destined for digital presses will route to inkjet infrastructure. (Source: Precedence Research, 2024)
What This Means for Your Print Business● A $500B+ commercial printing market transitioning to digital is the structural opportunity that W2P software is built on top of.● The 50% increase in on-demand printing is not a trend. It's a permanent structural shift in how print gets produced and fulfilled.● At 60%+ digital adoption in commercial print, the production infrastructure is already there. The bottleneck is often the ordering and workflow layer, which is exactly what W2P solves.
Production is digital. The question is whether the ordering layer has caught up. The adoption data below answers that.
Web to Print Adoption & Usage Statistics
Adoption figures answer the practical question: who is actually using web to print software, and how much?
29. 72% of printing companies globally had adopted web to print solutions by the end of 2024.
Adoption crossed the majority threshold years ago. The industry is past the early-adopter stage; W2P is now the default operating model for most print businesses of any size. (Source: Market Growth Reports, 2024)
30. In 2023, approximately 68% of small and medium-sized enterprises in North America integrated web to print platforms to streamline customer engagement and order fulfillment.
SMB adoption is catching up to enterprise adoption. The simplification of W2P setup through SaaS platforms with lower technical barriers is the main driver. (Source: Market Growth Reports, 2023)
31. Over 45,000 businesses globally have shifted from traditional print ordering to digital platforms powered by web to print software.
This is a count of businesses that made a deliberate transition, not just those running a basic online form. It represents committed platform adopters with operational dependency on W2P. (Source: Market Growth Reports, 2024)
32. 60% of commercial printers in North America adopted web-based ordering systems by 2023.
Nearly two in three North American commercial printers have a web ordering layer. The gap between web-enabled and non-web-enabled businesses is now a competitive differentiator, not a technology curiosity. (Source: Market Growth Reports, 2023)
33. 63% of global print service providers now integrate online ordering and automation platforms.
Automation integration (not just web ordering, but automated workflow) is the more demanding bar, and 63% have cleared it. That number is growing. (Source: 360 Research Reports, 2025)
34. Mobile-optimized W2P portals accounted for 48% of new software deployments in 2024, driven by global mobile internet usage exceeding 55%.
Mobile-first is no longer a differentiator for W2P platforms. It's a baseline requirement. Deployments without mobile optimization are losing orders at the top of the funnel. (Source: Market Growth Reports, 2024)
35. Cloud-based platforms accounted for 61% of new W2P deployments in recent periods.
Cloud deployment is now the majority model. On-premise still holds 74.67% of the installed base (legacy infrastructure), but new deployments have decisively shifted to cloud. (Source: StartUs Insights / Mordor Intelligence, 2024)
36. In 2023, the market saw a 28% rise in online print orders compared to traditional ordering methods.
Year-on-year growth of 28% in online orders is significant. It reflects both new volume and the conversion of existing clients from phone and email to web. (Source: Market Growth Reports, 2023)
What This Means for Your Print Business● 72% adoption does not mean you've missed the window. It means the competition is real and established. The businesses in that 72% vary enormously in how well they've implemented. Most W2P deployments are underutilized.● If your storefront doesn't work on a phone, you are losing order volume. Not hypothetically. Concretely.
Adoption numbers show who has W2P. Efficiency numbers show what actually happens when it's running.
Web to Print Efficiency & ROI Statistics
The business case for W2P is not abstract. These numbers describe what happens to operations when the switch gets made.
37. Average print order processing time decreases by 37% with W2P adoption.
A 37% reduction in processing time is not incremental improvement. It's a structural change in how labor is allocated. Work that was consuming manual hours gets absorbed by the platform. (Source: Market Growth Reports, 2024)
38. Automated print queues reduce operational delays by 41% and enhance production efficiency by 39%.
Two separate operational metrics, both approaching 40% improvement. At that scale, automation pays for itself quickly. (Source: 360 Research Reports, 2025)
39. Print houses adopting API-driven workflows report 52% higher order accuracy.
Error rates in print production are expensive: rework, waste, and customer friction all have real costs. A 52% accuracy improvement directly reduces those costs. (Source: 360 Research Reports, 2025)
40. W2P tools using automated prepress and digital proofing significantly cut error rates and reduce manual revision cycles.
Prepress errors are where jobs go wrong and margins disappear. Automated file checking (resolution, bleeds, color modes) removes the most common failure points before they reach the press. (Source: Infigo / SkyQuest, 2024)
41. Around 46% of marketing agencies use automated proofing to reduce manual revisions by 33%.
This stat speaks to the corporate buyer side. Marketing teams managing high-volume, brand-sensitive print collateral are heavy users of approval and proofing workflows. (Source: 360 Research Reports, 2025)
42. Multi-location corporations report 58% improvements in brand consistency through centralized W2P asset management portals.
Brand consistency is the core B2B selling proposition for W2P. When a company has 50 locations ordering printed materials, centralized template control is the only way to prevent brand drift. (Source: 360 Research Reports, 2025)

43. Businesses using process automation report cost reductions between 10% and 50%, primarily by automating repetitive tasks and minimizing manual errors.
The 10–50% range reflects how different operations are from each other. For a print shop with high manual order intake, the savings land near the top of that range. (Source: Statista via KRC Research, 2024)
W2P Efficiency Gains at a Glance
What This Means for Your Print Business● The 37% processing time reduction and 52% accuracy improvement are the two figures to put in front of anyone who asks 'is this worth the cost?' They're averages, not cherry-picked case studies.● The 10–50% cost reduction range is honest. Don't use the top end of that range in a business case unless you genuinely have a heavily manual operation. It will undermine credibility when the actual results come in lower.
Efficiency gains look different in B2B than they do for a consumer-facing (B2C) print shop. The dynamics, the buying process, and what buyers actually care about are different enough to deserve their own section.
B2B Print & Corporate Print Portal Statistics
Corporate print is not consumer print with bigger orders. It's procurement-driven, brand-controlled, and often tied to compliance requirements that B2C storefronts don't have. The sales motion is different, and the product has to be different too.
44. The web to print B2B segment is expanding as enterprises digitize procurement of marketing and packaging materials.
The driver in B2B is not convenience. It's control. Corporate buyers want locked templates, approval workflows, and centralized billing. W2P platforms that lead with speed instead of governance tend to lose enterprise deals to platforms that don't. (Source: Market Research Future, 2025)
45. 61% of B2B buyers prefer automated proofing and approval in print procurement workflows.
Approval bottlenecks are where B2B print jobs stall for days or weeks. Automated proofing removes human gatekeeping from the parts of the process that don't require judgment: file compliance, color accuracy, bleed settings. (Source: 360 Research Reports, 2025)
46. 98% of B2B marketers say automation is crucial to their success.
This figure comes from broader B2B marketing automation data. It's worth including because the clients managing large print programs are the same buyers who use marketing automation tools. Their expectations about workflow efficiency don't change when they open a print portal. (Source: Industry Survey Data, 2024)

47. AI-powered personalization in print is used by 54% of enterprise W2P customers, enabling automated design scaling across 37% more product types.
Enterprise W2P is no longer about uploading a logo and choosing a template size. AI-driven personalization is scaling variable data production in ways that used to require dedicated VDP specialist workflows. (Source: 360 Research Reports, 2025)
48. Integration of AI in print ordering and job management rose by 21%, improving user experience through personalized recommendations and automated workflow routing.
AI in B2B print is deployed and growing. The value is in reducing human touchpoints that slow high-volume ordering, not in flashy design tools. (Source: Market Growth Reports, 2024)
49. Portal adoption in B2B print environments reduces customer service overhead and manual order churn, helping preserve margin as order volumes grow.
This one rarely shows up in market reports, but it's worth naming. B2B clients who've set up approval workflows and templates on a specific platform don't switch vendors casually. Switching cost is real and it works in the platform's favor. (Source: Infigo, 2025)
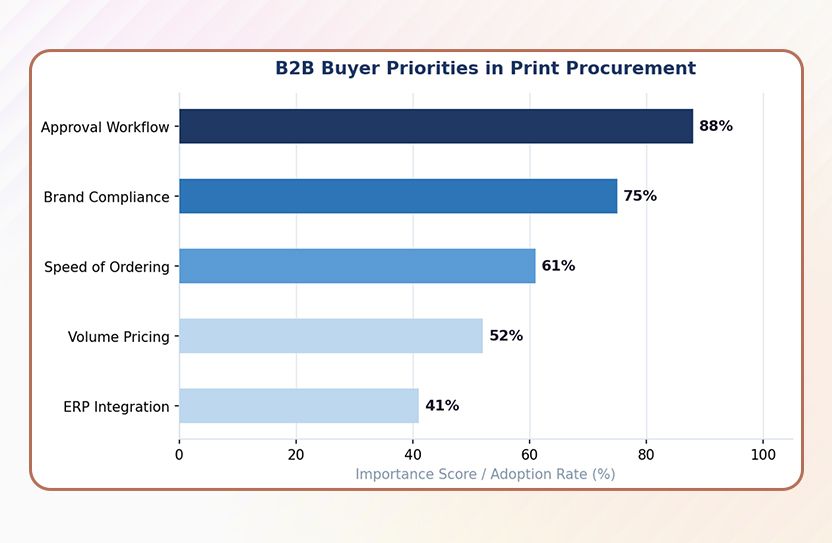
What This Means for Your Print Business● B2B W2P is sold on control and compliance, not just speed. If you're pitching corporate clients, lead with brand governance and approval workflow capabilities.● 61% of B2B buyers wanting automated proofing means it's no longer a premium feature; it's a baseline expectation in enterprise print procurement.● AI personalization at 54% enterprise adoption means variable data printing is becoming a standard capability, not a specialty offering.
B2B print is controlled by procurement and brand compliance. Consumer print is controlled by behavior. The next section covers what customer behavior data actually says about what online print buyers want
Print eCommerce & Customer Behavior Statistics
The consumer side of print eCommerce is driven by the same behaviors reshaping retail broadly: demand for personalization, mobile-first browsing, and frictionless ordering.
50. Nearly 60% of consumers prefer customizable printing options.
A majority preference, not a niche one. Platforms with rigid catalogs and limited personalization are losing customers to platforms that offer neither of those constraints. (Source: Market Growth Reports, 2024)
51. Variable data printing has achieved a 33% adoption rate among printing houses.
One in three printers runs VDP operationally. Demand from W2P platforms will continue to pull that number up, because personalization at scale requires VDP infrastructure behind it. (Source: Market Growth Reports, 2024
52. E-commerce sales reached approximately $6 trillion globally in 2024, creating direct demand for W2P solutions as brands seek consistent print-digital alignment.
Print and e-commerce are not separate channels. Brands managing complex online presences need packaging, inserts, and promotional materials to stay in sync with digital assets. W2P is the operational layer that makes that possible. (Source: Market Research Future / IMARC Group, 2024)
53–54. Browser-based print customization tool adoption grew by 48–49% in 2024–2025.
Two separate reports, slightly different windows, close enough figures to treat as one consistent finding. Browser-based design tools are the fastest-growing interface type in W2P customer interactions, and the growth makes sense: users who don't want to learn design software can still produce print-ready files.
The lower the friction, the higher the conversion. This is not a complicated insight, but a lot of print storefronts still require customers to upload finished files rather than build them in-browser. (Source: 360 Research Reports, 2025)
55. Adobe's integration of Zazzle checkout tools inside Adobe Express in late 2024 signaled the convergence of design software and print fulfillment platforms.
When Adobe builds print ordering into its design tool, it's not a product feature announcement. It's a strategic signal about where the market is heading. Design and print are merging at the platform layer, and the companies that understand that early will be better positioned than the ones that treat design and fulfillment as separate problems. (Source: Mordor Intelligence, 2025)
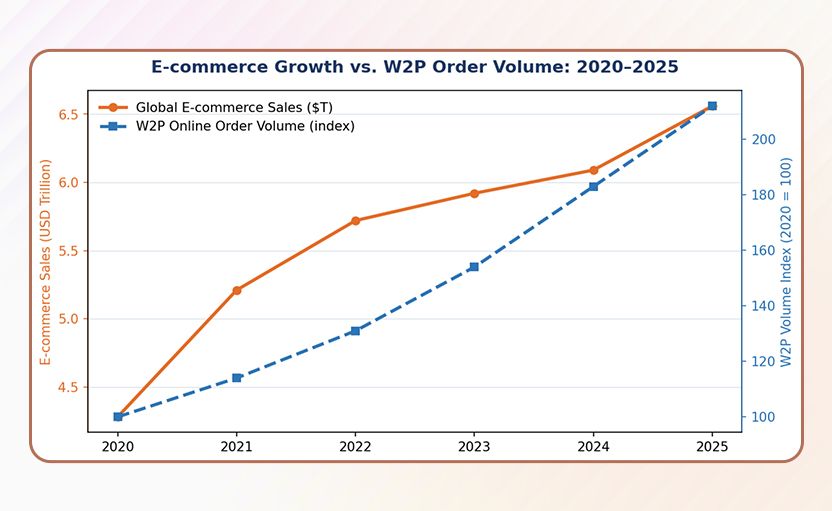
What This Means for Your Print Business● 60% of consumers preferring customization means standard catalog products without personalization options, lose out to platforms that offer them.● The $6 trillion e-commerce market is the demand engine for print packaging and collateral. Your B2C customers are already buying online. Their print needs follow the same channel.● Browser-based design tool growth (48–49%) shows that low-friction customization drives volume. UX is a conversion metric in print e-commerce.
Customer behavior shapes demand. Technology investment shapes what platforms can actually deliver. These two things have to be in sync.
Web to Print Technology & Feature Adoption Statistics
These stats describe where W2P vendors are investing and what's entering mainstream use. The five-category investment pattern in stat 59 is probably the most useful single data point in this section.
56) AI integration in print ordering and job management rose by 21% in 2024, with AI-driven design tools now used by 54% of enterprise W2P customers.
AI in W2P is bifurcating: consumer-facing tools (design automation, intelligent templates) and production-facing tools (job routing, quality checking, scheduling). Both are growing, driven by different buyers. (Source: Market Growth Reports; 360 Research Reports, 2024–2025)
57. Nearly 45% of new W2P software solutions now offer mobile compatibility as a core feature.
Mobile is still catching up as a core (rather than optional) feature. Platforms treating mobile as an afterthought are already behind buyer expectations. (Source: Market Growth Reports, 2024)
58. Cloud-based W2P solution adoption is expected to increase by over 30% in coming years, driven by SaaS economics and easier integrations.
Cloud adoption in W2P mirrors the broader enterprise software transition. The operational benefits (automatic updates, lower IT overhead, API-based integrations) are well-established. (Source: Market Research Future, 2025)
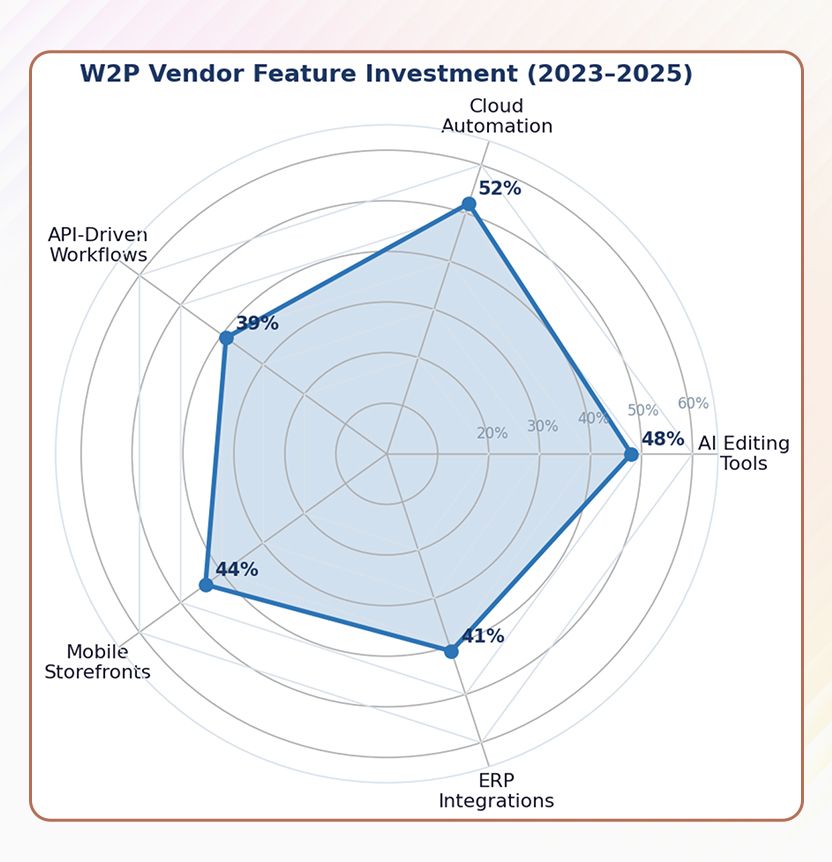
59. Between 2023–2025, 48% of W2P vendors launched new AI editing tools, 52% enhanced cloud automation, 39% added API-driven workflows, 44% improved mobile storefronts, and 41% expanded ERP integrations.
This vendor investment pattern shows where the competitive battleground is: AI features, cloud infrastructure, and system integration. Platforms that aren't investing in at least three of these five areas are falling behind. (Source: 360 Research Reports, 2025)
60. 57% of W2P solutions have adopted cloud-based infrastructure globally.
More than half of the market has moved to cloud. The shift is structural and unlikely to reverse. On-premise deployments will remain for specific compliance use cases, but they're not the growth segment. (Source: 360 Research Reports, 2025)
61. API-driven workflows are now used by 39% of W2P vendors, enabling direct integration with MIS, ERP, and production systems.
API integration turns W2P from a storefront into a production operations platform. The businesses that have made this integration report 52% higher order accuracy. The connection is direct. (Source: 360 Research Reports, 2025)
What This Means for Your Print Business● If you're evaluating W2P platforms, the five investment categories (AI, cloud automation, APIs, mobile, ERP integration) are a practical checklist for capability comparison.● API integration is the feature that converts W2P from a customer-facing tool into a production-connected platform. It's worth prioritizing over cosmetic features.● 57% cloud adoption and 30% projected growth means cloud-first infrastructure is the right architecture assumption for any platform investment made today.
The technology capabilities exist. The adoption gap between what's available and what's actually deployed is where the challenges section picks up.
Print Industry Challenges & Pain Points
Growth numbers don't tell the full story. These statistics describe the friction points that are slowing web to print adoption and creating operational risk.
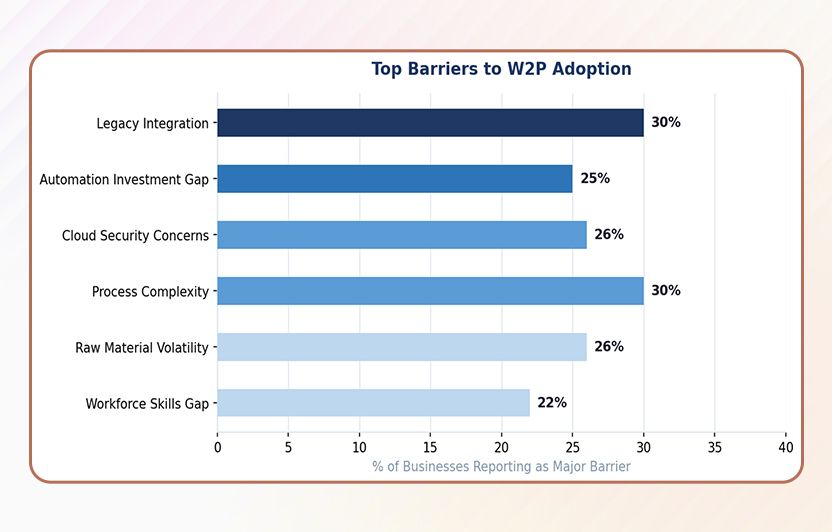
62. Over 30% of small print shops report challenges in syncing older hardware with new digital storefronts.
Legacy integration is the number one practical barrier to W2P adoption at smaller print businesses. The issue is not willingness. It's the gap between the software expectation and the physical infrastructure behind it. (Source: Market Growth Reports, 2024)
63. 26% of businesses cite cloud security as a major deterrent to cloud-based W2P adoption.
Security concerns slow cloud adoption in print, just as they do in every other sector. The concerns are legitimate: W2P platforms handle customer data, payment information, and proprietary artwork. These concerns are increasingly well-addressed by enterprise-grade platforms. (Source: StartUs Insights, 2024)
64. 80% of print professionals say AI and automation are essential, but only 55% are currently investing in the technologies they describe as essential.
The gap between stated priority and actual investment is 25 percentage points. That gap exists because implementation is harder than belief. Firms that close it gain a structural advantage over the majority that doesn't. (Source: Infigo / Industry Survey, 2025)

65. 54% of organizations implementing workflow automation say mapping complex processes is a major challenge.
Process complexity is real. W2P platforms simplify order intake and production routing, but the integration work of connecting existing MIS, ERP, and production systems requires planning and expertise. (Source: Salesforce Survey via SoftwareOasis, 2024)
66. Dynamic pricing of raw materials poses a significant ongoing challenge for print businesses, with cost fluctuations affecting profitability unpredictably.
Input cost volatility (paper, ink, substrate) affects margin in ways that software can't fully absorb. W2P platforms that offer real-time pricing automation (like PrintIQ's cloud intelligence module) help mitigate exposure. (Source: Technavio; Mordor Intelligence, 2024–2025)
67. Workforce skills gaps in automation and digital workflow management are an ongoing constraint to W2P adoption, particularly for smaller printers.
This is the softer side of the adoption barrier: platforms can be purchased, but they require people who know how to run them. Training investment is a real cost that budget models sometimes undercount. (Source: SkyQuest; Industry Reports, 2024)
What This Means for Your Print Business● If you're a W2P software buyer: the legacy integration challenge is solvable, but it requires realistic timeline planning and probably professional services support.● The 80%/55% belief-versus-investment gap is something you can exploit if you're a competitor. Move on automation before your market does.● Security concerns are a legitimate sales objection in B2B print. Platform vendors should have documented security certifications and data handling policies ready.
The challenges are real. The future data below suggests the businesses that work through them in the next two to three years are building on the right side of a significant structural shift.
Web to Print Future Outlook & Predictions
All the projections mentioned below are not guarantees. But when multiple independent forecasters point the same direction, the direction is worth trusting even if the exact numbers aren't.
68. The W2P software market is projected to reach between $2.6 billion and $18.69 billion by 2033–2035, depending on scope definition.
The range is wide because different firms measure different things. The consistent conclusion: the software layer is growing faster than the overall market, and that trend continues. (Source: 360 Research Reports; Market Research Future, 2025)
69. The Asia-Pacific W2P software market is projected to grow at a 12.5% CAGR from 2024 to 2032, the fastest regional growth rate globally.
APAC is not a future growth opportunity. It's a current growth reality. Platforms not serving APAC markets today are watching addressable market grow outside their reach. (Source: Market Research Future, 2025)
70. AI adoption in print automation is projected to grow from 74% of platforms in 2024 to 94% by 2029.
In five years, AI will be a standard feature across virtually every professional W2P platform. Platforms without AI will be legacy software by 2030. (Source: SoftwareOasis / Business Process Automation Data, 2024)

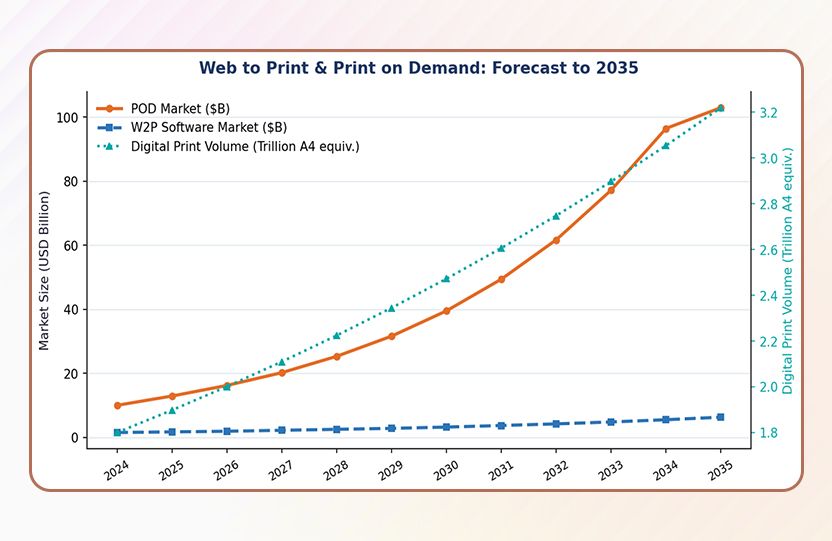
71. The print on demand market is projected to sustain approximately 25% annual growth through 2033, potentially reaching $75–103 billion.
POD's growth rate is essentially compounding. Each year of 25% growth adds more absolute volume than the year before. The infrastructure layer (W2P platforms) scales in step with that. (Source: Straits Research; Precedence Research, 2025)
72. Digital printing volumes are forecast to increase from 1.8 trillion A4 print equivalents in 2025 to 2.8 trillion by 2035, a 54.3% volume increase over ten years.
Volume growth at the production layer means more jobs flowing through W2P ordering systems. The infrastructure demand behind this forecast is substantial. (Source: RevenueMemo / Industry Data, 2025)
73. The percentage of businesses automating at least one print-related process is projected to grow from 66% in 2024 to 85% in 2029.
By 2029, automation will be the default operating mode across print, not the advanced option. Businesses building on non-automated infrastructure today are building into obsolescence. (Source: SoftwareOasis, 2024)
What This Means for Your Print Business
- AI at 94% platform adoption by 2029 means it will be table stakes, not a differentiator. Build for it now while it still creates competitive advantage.
- APAC at 12.5% CAGR is the most important regional story in W2P over the next five years. If your platform supports international storefronts and multi-language operations, this is addressable growth.
- The 54.3% digital volume increase by 2035 means your W2P infrastructure needs to scale across order throughput, file management, and API capacity, not just add features.
Key TakeawaysThe market isn’t something that’s “coming soon.” It’s already here. When 72% of print businesses are using W2P and seeing faster processing, fewer errors, and stronger brand control, those aren’t theoretical benefits. That’s just how their day to day operations work now.The harder place to be is on the outside looking in. Print buyers are getting used to ordering online, approving jobs faster, and not chasing emails or PDFs. Once that expectation is set, manual workflows don’t just feel slower, they feel frustrating.So for most print businesses, the question isn’t whether to adopt W2P anymore. It’s how fast you can move and what you tackle first.For many teams, the best approach is a simple, stepbystep one: start with a solid customerfacing web to print storefront, automate the messy manual work behind it, and then connect everything to your production systems. Do not hurry on making everything work right on the day 1. The real value of implementing or adopting web to print software shows up along the way, and each step makes the next one easier.
Ready to See What W2P Can Do for Your Business?
- OnPrintShop has worked with 2,000+ print businesses across 18+ years in the web to print industry.
- Explore: Web to Print Storefront | Print Order Management | Variable Data Printing | Workflow Automation
- Contact our team or book a demo to see the platform in action.